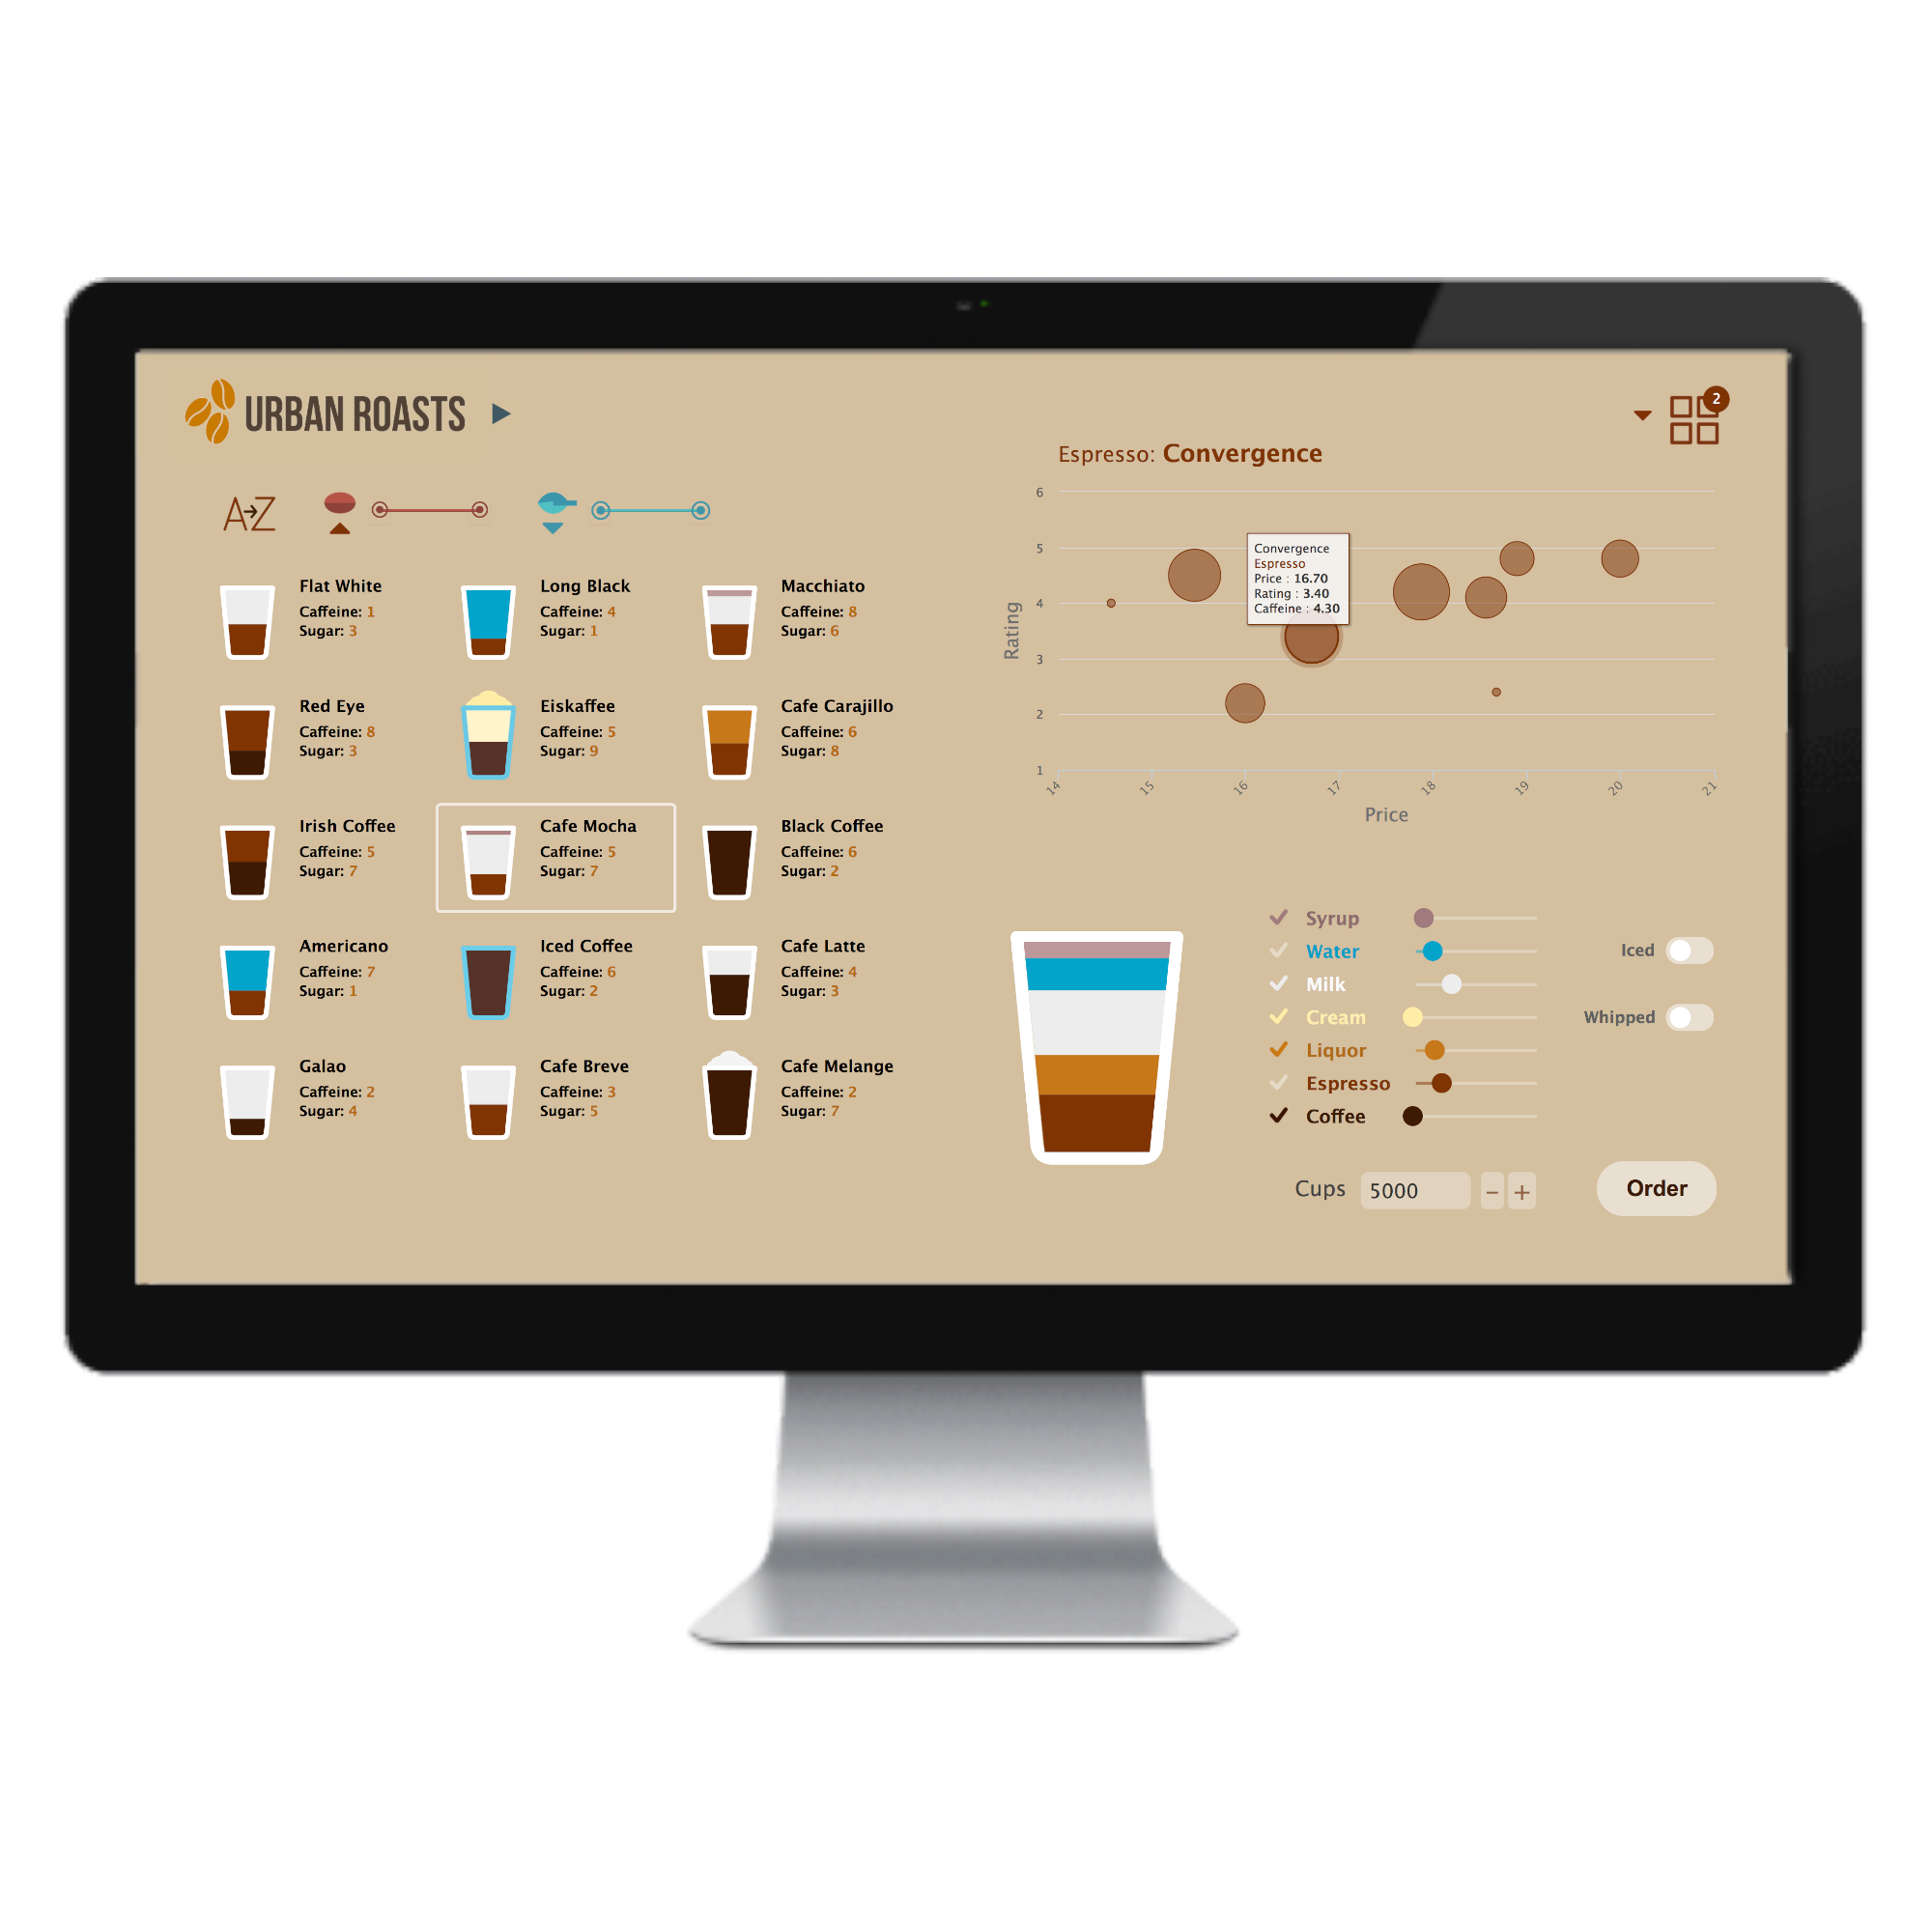
Today, I am pleased to announce the release of TIBCO Jaspersoft 7, the latest version of our embeddable reporting and analytics software. Jaspersoft is not your typical BI & Analytics tool. It is uniquely designed to address the needs of software builders—those who are developing software applications and understand the power and potential of exposing data to users in the right context. Jaspersoft 7 extends our pallet of building block components, enabling developers to build intuitive data experiences into their application.
This release features a streamlined workflow for building beautiful data visualizations using a drag-and-drop web designer and embedding them deeply into application user experiences. This deep integration is made possible with Visualize.js—our award-winning JavaScript API for embedding analytics into web and mobile-web applications. For those of you familiar with Jaspersoft, this new workflow is made possible through the ability to embed newly designed Ad Hoc View components using Visualize.js.

See everything that’s new in the release and learn more about Visualize.js (including live code samples) by visiting the Jaspersoft 7 launch site.

